In previous parts, I described my toughts about Consensio. In this part, after watch this video, from Tyler Jenks:
I decided to implement something more complete than my previous Consensio Indicators. This is my rant about the topic.
I will coment things about the theory exposed in the video and some changes I made in order to acomodate the results in an indicator more siutable to be the base of an strategy (with easy compable values in order to make the conditions for entry/exit increase/decrease the positions in the asset more easy, using the point of view of a programmer)
About the video
In the video, Tyler describes Consensio as a way of «categorize» the status of an asset: is in a bullish market?, in a bear one?, and how bear o bull is?
In all the video, Tyles uses 2 SMAs, the call them Intermediate SMA and Long SMA, and make comparisions with price. But instead os use the price values, uses a mini-SMA of 2 weeks to smooth the values, so, from now on, all this article will call the 3 data as Price, Short SMA, and Long SMA
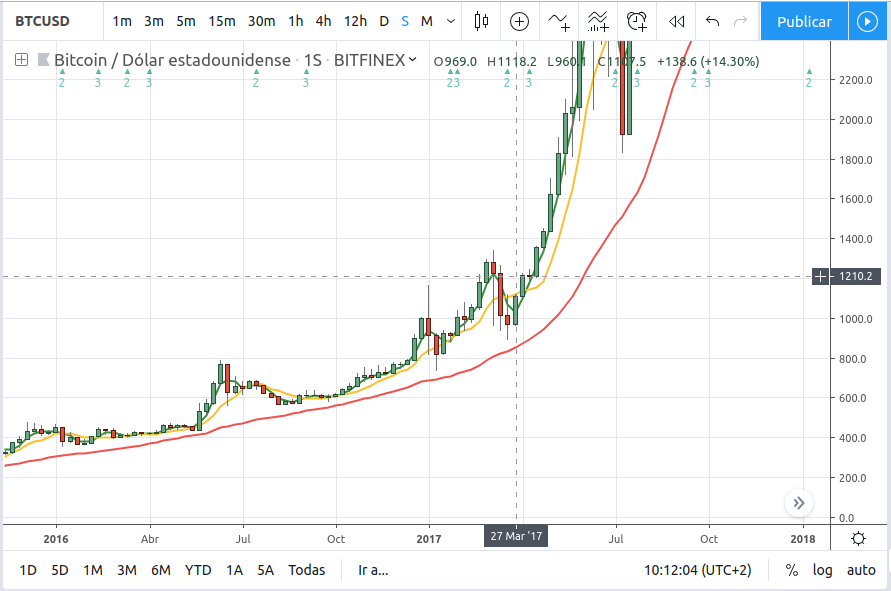
In all the videos from Tyler, he uses weekly timeframe, with SMA values of 2, 7 and 30 weeks periods.
Tyles describes two variables to value the perform of an asset, first the «Directionalities»
Directionalities
If we have 3 different period SMAs, and we use 3 states to distinguiss the direction of each one (is going up, is flat or is going down), we can categorize the status of the «direction» of the asset in function of these combinations.
For example, in a full bull market, the SMAs, for price, short and long will be facing up, In the opposite, in a full bear market, the 3 SMAa will be facing down.
Ok, but how we categorize the rest of the posible states? For example, if only the long SMA is facing up and the short and the price are facing down?
As combinatorial result, there is 27 states. Tyler breaks those in 3 tables of 9 states, one for Bull level, other for Bear levels and another for Flat levels.
In his video, level 1 is more powerfull than level 9.
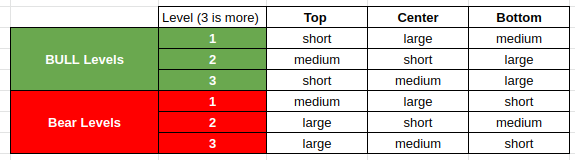
This are the tables of combinations (extracted from the video):

Tylers is taken this tables from an old presentation, maybe from a brochure. The thing about brochures is they are written with the presentation and the logos and the format in main, instead of rigurosity.
I study those tables and I think that simply are bad transcribed… for example, the Flat table values 5 and 8 have the same dfirectionalites, and the bull and bear tables gives more weight to price than the short SMA (I think the column titles are swapped)
With these tables, you can name the «directionality» of an asset, with something like: Bull 1, or Bear 3, etc.
This is cool from an investor poin of view, but as programmer, I like to include all on this in a simple value, positive from bull markets and negative for bear markets, in order to manage just a variable instead of jump into a nighmare of concatenated ‘if’ code like: if bull then if bear then, etc, so I wrote my own tables, with the (I think) correct weights and reorganize the values to reflect this: one unique level from -13 to 13 showing the direction of the asset.
13 will be the more bullish scenario, 0 mean totaly flat market and -13 the more bearish scenario.
These are my tables:

Relativities
The second thing to measure the class of an asset mentioned in the video is called «Relativities».
Takes the denomination from the relative position of each SMAa with the others.
For study them, Tyler uses a simulation where he changes the price for a signal with a well know oscillation: a sine wave.
From this sine wave, calculates 2 SMAs, the short period and the long period. With this conditions, he studys the interaction of the 3 signals, watching the positional orders of them (witch is in the top, in the middle or in the bottom position).
In this figure, you can see the simulation:

Green will be the Price, Yellow the short SMA and Red the Long SMA.
We can see a full cycle: prices going up, a period of «flattiness» in the upper part of the sine waves and prices going down. (Also we can notice the «smoothiness» from the signals… a longer SMAs does not reach the same amplitude as the price or the sorter one…)
Also we can see that the first signal going up is the price, then the sort and then the large period SMA.
If we break down this full cycle, anotating the interactions of the signals, we (almost) get the complete order in witch the signals go from cero to high and viceversa. I say almost, because with this kind of signal you can not reach all the possible combinations of positional orders than the reality can achieve. In order to get the full picture we will need another combination of signals.
Because in the real world, with real price data, the prices does not oscillate as a sine waves, all these combinations are possible, so we need to categorize aswell.
If we do this exercise, all we get is 13 possibles combinations.
Tyler denominates those combinations with letters, from A to M and this is the table of possible combinations:
(P goes for Price, Short for the Short SMA and Long for the Long SMA)

In this case, if the asset transition from estate M to state A will be indicating that a new bull market is starting.
If a Bull market level 1 is starting to decline, It will be making transitions to upper lleters: to B, C, D etc, untill reach the G level (flat market or about to transitioning to bear market), and if this down trend continues, it will end in K, L, M states (if not reverse first).
So, this letters provides like a compass. I see this like a circle, if the letters increase, the cicle increase, from bull, to flat to bear, completing a full cycle.
In my indicator,I use this table but, instead of use an «Equal» comparison, I use «Equal» or crosses, in order to get all the crosses happening between 2 candles and show those in my indicator.
If I use strictly comparison in my code, in reality we will be loosing too many transitions, so, I instead of use an strictly comparison (A==B) I compare the percent of change between the 2 values and if is greater than a treshold (definable in the indicator) mark as «above», if is less tan the treshold is mark as «Below» and if is not greater or smaller tan the treshold (or if the 2 SMAs has crossed) I consider the 2 values as «Equal or Crossed» and take note of this and show the value of that transition in the indicator.
I made myself a sine wave generator, and inyected his signal instead of price into my indicator, in order to see all the changes in state that this signals can offer to us.
Here you have a picture showing the starting of a bull market:

As usual, Green is price, Yellow is the short SMA and red the long one.
You can see in the lower part, the transition of the letterts, going from states J, K, L to A, B, C, until reach G letter, indicating a change is goint to take place.
This is the Bear cycle starting:

In this case, the letters goes from F, G to H, I, J K showing the progress of the sine waves in to the bear cycle.
Note that with this signals there are states missing, like the M, because is almost impossible with this simulation and those values than the 3 signals be equal or crosses at the same time (perhaps doing some tunning…) But this can happen in reality, so we include all the combinations.
How looks this kind of indicator with real prices?, let see some examples:
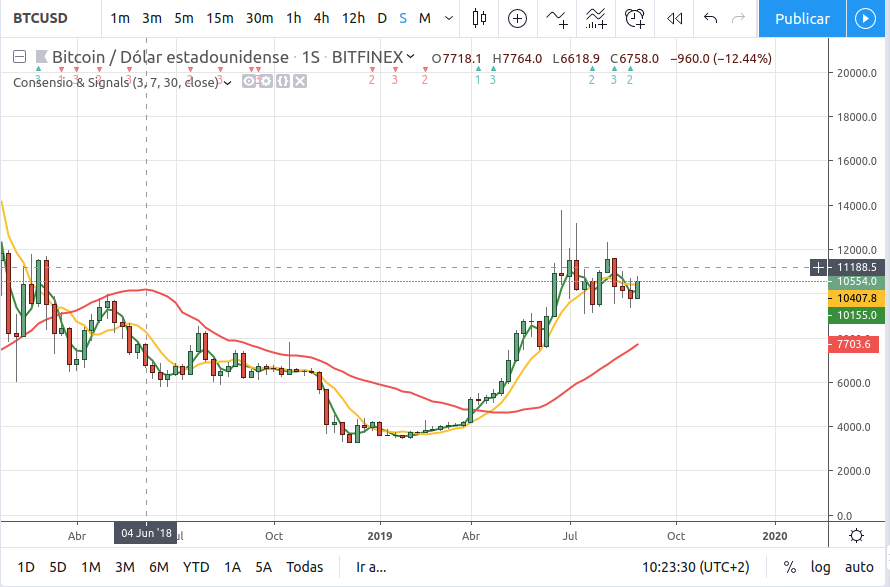
Bitcoin:

Here we can see the last bull cycle to the ATH, the falling in to bear market and raising again.
Of course, the indicator is delayed, because of the SMAs.
SPX 500

Gold

I like this indicator to «navigate» lists of tickers, and get in seconds a view of their status, and, if this is good, analyze in more detail with other tools.
The name of this indicator is Consensio REAL (Sorry for the lack of imagination choosing the name), and you can find it in Tradingview Public library.
In this URL you can find All of my published scripts in Tradingview: Nakitxu’s Tradingview Indicators, for now, all of them are open to the public.
Don’t hesitate in leave any comments of suggestions (and push the like & follow button… it helps)